Deployment Options
Deployment mode does not change app UI semantics. An app may ship widget UI and main UI sources; KDCube builds, serves, and scopes those surfaces alongside app APIs, operations, MCP endpoints, named-service providers, and static assets. A custom frontend or the KDCube control plane can render those surfaces directly or embed them, but the embed mechanism is outside the app contract. Internal deployment descriptors still use names such as bundles.yaml and bundle_id.
ECS Topology
Descriptor Release Contract
A release is not only a container image. The environment descriptors carry app versions, named-service provider registrations, namespace styles, shared UI sources, feature flags, and secret references that clients and agents use at runtime.
App descriptors
bundles.yaml selects app refs, app config, named-service tool policy, scene/shared-source wiring, and frontend-visible namespace style metadata.
Secrets descriptors
bundles.secrets.yaml and secrets.yaml describe app-scoped and platform-scoped secret material. The live authority may be local files, sidecar service, or AWS Secrets Manager.
Discovery and buses
Named-service discovery, event bus, and data bus depend on consistent runtime identity: tenant, project, app id, user id, session id, and surface ids.
See Object Ecosystem & Ontologic Contracts for the provider/consumer contract this descriptor layer enables.
Monitoring & Observability
The platform exposes operational signals through a combination of log streams, Redis-backed queue metrics, and a health endpoint. These signals are intended for operators monitoring a deployed instance.
Queue Depth
The chat-proc worker consumes a Redis-backed message queue. Queue depth (number of pending messages) is observable via standard Redis list length commands against the configured queue key. Elevated queue depth indicates processor backpressure or under-provisioning.
Processor Health
Each processor instance reports liveness through its internal health check. In ECS deployments the ALB target group tracks instance health; in Compose deployments a container health check is defined. Unhealthy processor instances are replaced or restarted by the orchestrator.
Log Streams
All platform services emit structured log output to stdout, captured by the container runtime. In ECS deployments logs flow to CloudWatch Logs; in Compose deployments they are available via docker compose logs. Log lines include request IDs, tenant/project scope, internal app id, and error classification where applicable.
Metrics Endpoint
The Operations REST API (served by chat-proc) exposes operational data accessible to authorized callers. App-level metrics (turn counts, economics state, error rates) can be queried via the Operations API using a privileged token. Prometheus-format scrape endpoints are not currently built in but can be added as an app operation.
Proxy Configuration
The OpenResty reverse proxy (web-proxy) sits in front of all backend services and handles TLS termination, security headers, rate limiting, auth cookie unmasking, and path-based routing.
Request Pipeline
-
1
TLS termination
Unwraps HTTPS, redirects HTTP to HTTPS, blocks direct IP access (returns
444). InjectsHSTS,X-Frame-Options,X-XSS-Protection, andReferrer-Policyheaders. Gzip compression on all text responses. -
2
Rate limiting
Per-IP
limit_reqzones for chat, KB, upload, and auth routes. Runs before auth unmask so DDoS bursts are dropped before burning aproxyloginround-trip. -
3
Auth cookie unmask
For every protected route, an
access_by_luacall tounmask_token()issues an internal subrequest toproxylogin /v1/unmask, extracts real session cookies, and injects them into the upstream request. -
4
Upstream routing
Path-based dispatch to backend services. SSE locations disable buffering with a 600s timeout; WebSocket locations handle protocol upgrade; SPA routes use a 404 fallback.
Upstream Backends
| Backend | Address | Routes |
|---|---|---|
web-ui | web-ui:80 | /chatbot/*, SPA fallback |
proxylogin | proxylogin | /auth/*, internal /auth/unmask |
chat-ingress | chat-ingress:8010 | /sse/, /api/chat/, /api/cb/*, /admin/*, /monitoring |
chat-proc | chat-proc:8020 | /api/integrations/, /admin/integrations/ |
kb | kb:8000 | /api/kb/ |
Rate Limit Zones
| Zone | Rate | Applied To |
|---|---|---|
chat_api_zone | 10 r/s | /api/chat/, /sse/ |
kb_api_zone | 10 r/s | /api/kb/ |
monitoring_api | 10 r/s | /monitoring |
upload | 2 r/s | Upload endpoints |
limit_req zone=chat_api_zone burst=20 nodelay;. For anti-DDoS hardening, add limit_conn zones, timeout hardening, and auth-specific rate zones. See the proxy ops guide for WAF options (lua-resty-waf or ModSecurity + OWASP CRS).Connection Pooling
Redis and Postgres connection pools are created once per worker process during FastAPI lifespan startup and stored in app.state. Total connections scale with worker count.
Redis Pools
| Component | Pools per Worker | Max Connections Formula |
|---|---|---|
ingress / metrics | 3 (async, async_decode, sync) | 3 × redis_max_connections |
proc | 1 (shared async) | redis_max_connections |
Pool size is controlled by GATEWAY_CONFIG_JSON.pools.<component>.redis_max_connections. If unset, the pool is unbounded and grows with load. Pub/sub and blocking calls consume connections from the pool, not on top of the cap.
Postgres Pool
Each worker creates one asyncpg pool. Size is controlled by pools.<component>.pg_pool_max_size and pg_pool_min_size. If not set, it defaults to service_capacity.<component>.concurrent_requests_per_process.
# Total connections per instance
pg_conns_per_instance = workers × pg_pool_max_size
redis_conns_per_instance = workers × pools_per_worker × redis_max_connections
Connection Lifecycle
Shared Redis clients set socket_connect_timeout=5, health_check_interval=30, socket_keepalive=True, and retry_on_timeout=True. A centralized Redis health monitor tracks PING health and emits up/down events. On reconnect, the service automatically rebuilds SSE relay subscriptions and reconnects gateway config pub/sub listeners.
processes_per_instance, total Postgres and Redis connections increase proportionally. Ensure total_pg_connections fits within max_connections on the database and total_redis_connections fits within ElastiCache maxclients.Health Checks
Every service exposes a GET /health endpoint for use by orchestrators (ECS target groups, Docker Compose health checks) and load balancers.
Endpoints by Service
| Service | Endpoint | Checks | Readiness |
|---|---|---|---|
| chat-ingress | GET /health | Service up, draining flag, Socket.IO enabled, SSE enabled, instance ID | 200 healthy / 503 draining |
| chat-proc | GET /health | Service up, draining flag, git app readiness + errors, instance ID | 200 healthy & apps ready / 503 draining or apps not ready |
| metrics | GET /health | Service up | 200 healthy |
| kb | GET /api/kb/health | KB stats, orchestrator health, queue stats, storage path | 200 healthy / 503 unavailable |
| kb (process) | GET /api/kb/health/process | Per-process capacity | 200 healthy / 503 unavailable |
Readiness vs Liveness
All health endpoints serve as both liveness (is the process running?) and readiness (can it accept traffic?) probes. The draining flag differentiates the two: a draining instance returns 503 so the load balancer stops sending new requests while in-flight work completes. For chat-proc, readiness additionally requires that git apps have been cloned and are error-free.
/health endpoint. Unhealthy instances are replaced or restarted by the orchestrator.Kubernetes Deployment (Helm Charts)
KDCube ships native Helm charts for Kubernetes deployment. Tested on EKS, GKE, k3s, k3d, and Minikube — any CNCF-conformant cluster with a default StorageClass should work.
Quick Start
# 1. Create a k3d cluster
k3d cluster create kdcube --port "8080:80@loadbalancer"

# 2. Install infrastructure
helm install postgres-db charts/postgres-db
helm install redis charts/redis
helm install postgres-setup charts/postgres-setup

# 3. Install the platform
helm install kdcube charts/kdcube-platform \
  -f descriptors/local.yaml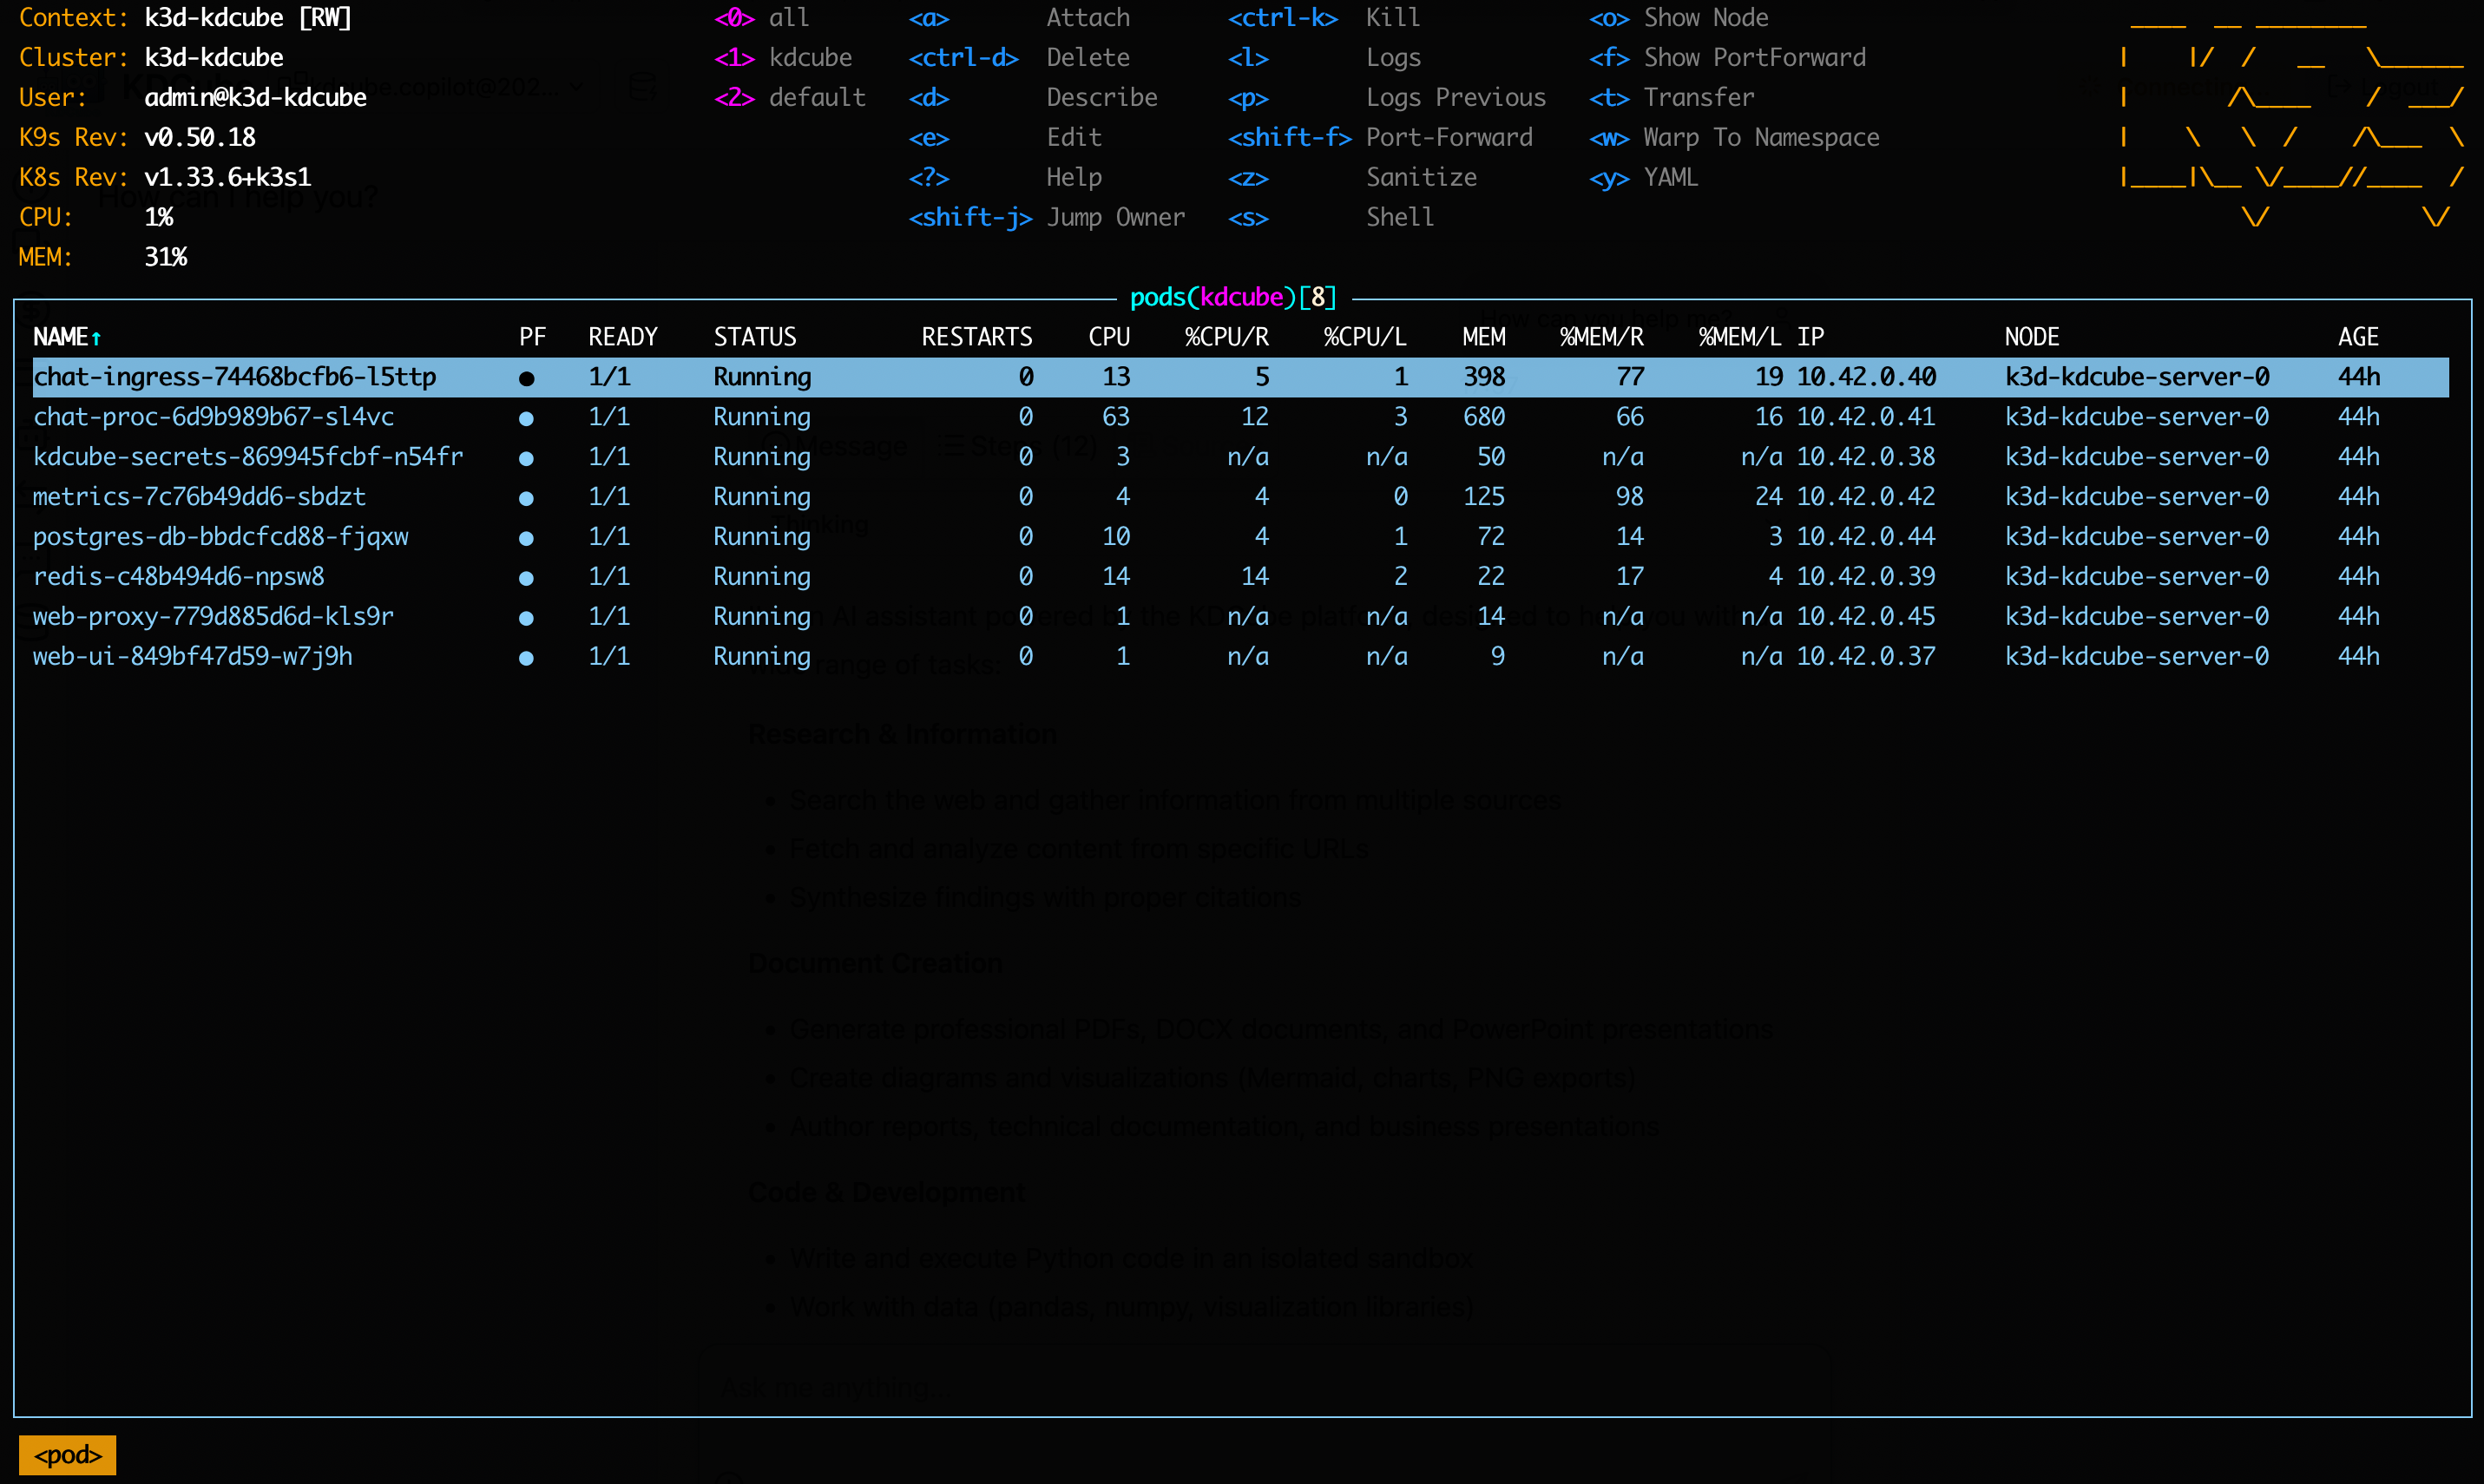
What Gets Installed
The recommended flow is descriptor-driven: keep environment-specific configuration in descriptors/*.yaml, install infrastructure charts first, then install the platform chart with descriptor overlays.
Infrastructure charts
charts/postgres-db— PostgreSQL with pgvectorcharts/redis— Redis with password authcharts/postgres-setup— one-shot schema/bootstrap job
Platform chart (kdcube-platform)
kdcube-secrets— secrets managerchat-ingress— API gatewaychat-proc— agent processormetrics— metrics aggregationweb-ui— chat web appweb-proxy— Nginx reverse proxy
PersistentVolumeClaims
The platform chart creates five PVCs by default: bundles, kdcube-storage, bundle-storage, exec-workspace, and kdcube-logs.
Full reference: kubernetes/local on GitHub.